
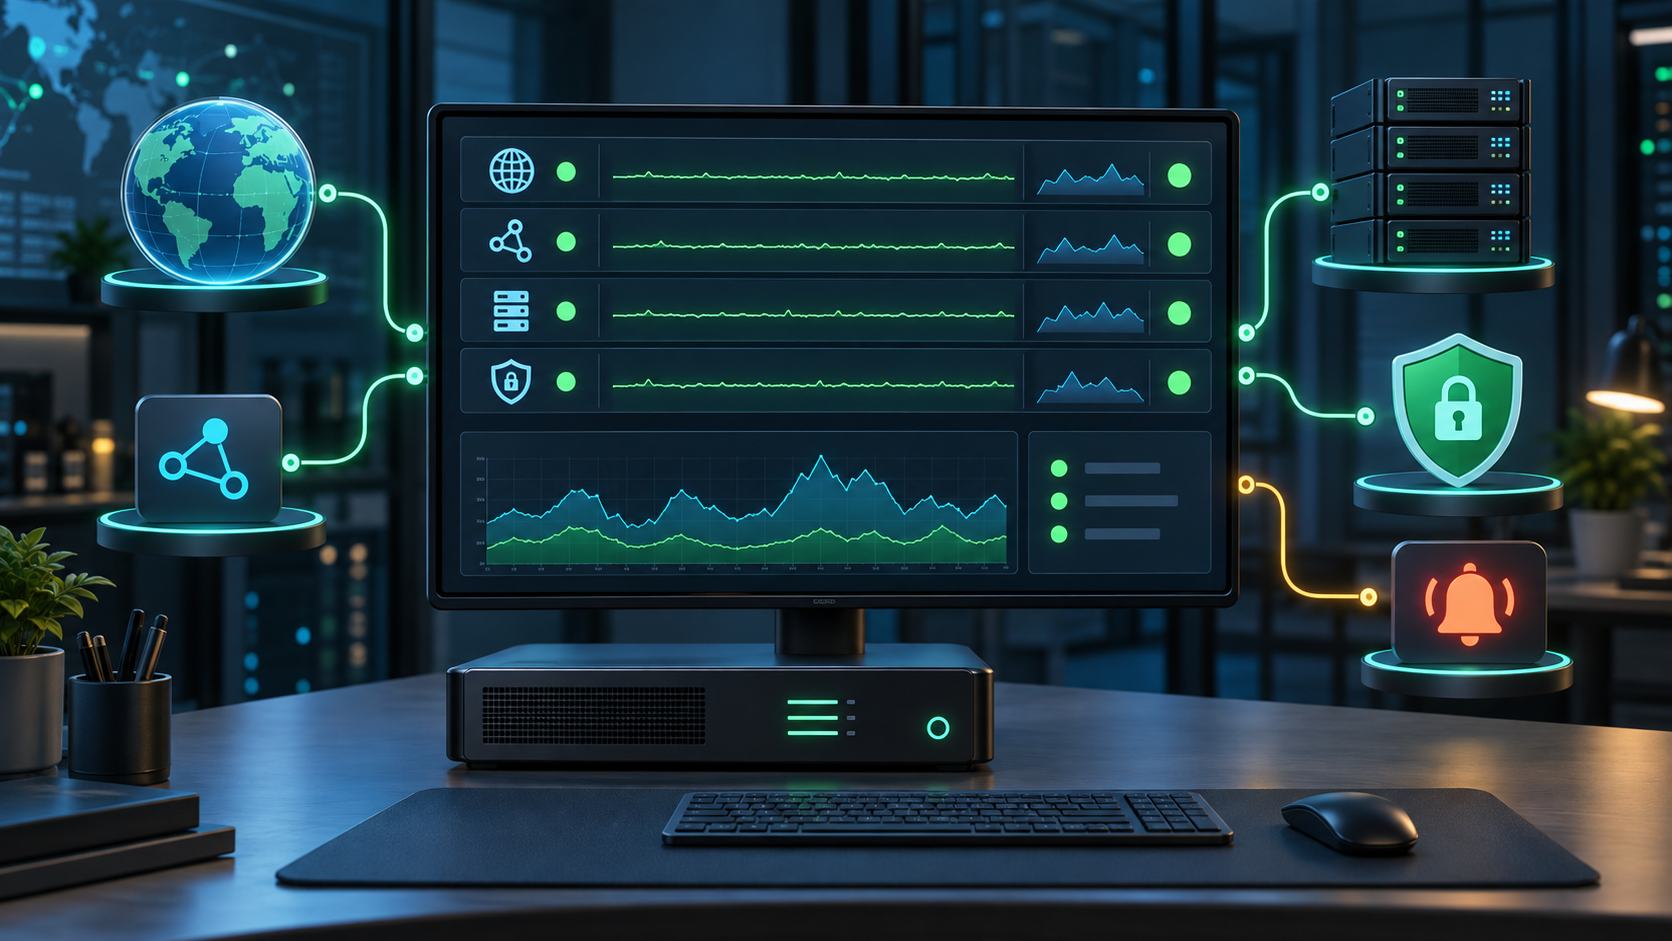
A website working when you manually open it does not mean it has been healthy all day. Regional DNS failures, expiring TLS certificates, incorrect API responses, or intermittent servers can continue for hours without proactive monitoring. Uptime Kuma is a self-hosted tool for periodic service checks, notifications, and status pages without building a full observability platform.
This guide deploys Uptime Kuma with Docker Compose on Ubuntu or Debian behind Nginx and HTTPS. The example follows the major image tag 2; review release notes and test updates against a backup before production.
What is Uptime Kuma good for?
- HTTP/HTTPS, keyword, or JSON checks for websites and APIs.
- TCP ports, ping, DNS, and selected infrastructure services.
- TLS certificate expiration monitoring.
- Heartbeat/push monitors for cron and backup jobs.
- Public or private status pages.
- Notifications through email, webhooks, and messaging platforms.
It does not replace logs, metrics, traces, or APM. Uptime monitoring answers whether a service works from a particular observation point; another tool is still needed to explain which query, resource, or code path caused a failure.
1. Choose the monitoring location
Do not place Uptime Kuma on the only server it monitors. If that host loses power or network connectivity, both the service and its alarm disappear. Prefer a small VPS in another provider or network region.
Prepare a Linux host with Docker Engine and the Compose plugin, a dedicated subdomain such as status.example.com, a restrictive firewall, and off-host backup storage. Use a domain or subdomain rather than a path such as example.com/uptime, which the project documentation does not support.
2. Create the directory structure
sudo mkdir -p /opt/uptime-kuma/data
cd /opt/uptime-kuma
The data directory holds the database, monitors, and persistent settings. Restrict it to the appropriate administrator and never commit it to Git.
3. Create the Docker Compose configuration
Create compose.yaml:
services:
  uptime-kuma:
    image: louislam/uptime-kuma:2
    container_name: uptime-kuma
    restart: unless-stopped
    ports:
      - "127.0.0.1:3001:3001"
    volumes:
      - ./data:/app/data
    security_opt:
      - no-new-privileges:true
Binding to 127.0.0.1 prevents port 3001 from being directly exposed; users connect through the HTTPS proxy. The /app/data volume is the critical backup target. Do not mount the Docker socket unless a required feature needs it, because the socket carries powerful host privileges.
docker compose pull
docker compose up -d
docker compose ps
docker compose logs --tail=100 uptime-kuma
On the server, test curl -I http://127.0.0.1:3001. If the container keeps restarting, inspect logs and data-directory permissions before configuring the proxy.
4. Configure Nginx and WebSocket proxying
Uptime Kuma uses WebSocket, so the reverse proxy must forward upgrade headers:
server {
    listen 80;
    server_name status.example.com;

    location / {
        proxy_pass http://127.0.0.1:3001;
        proxy_http_version 1.1;
        proxy_set_header Host $host;
        proxy_set_header X-Real-IP $remote_addr;
        proxy_set_header X-Forwarded-For $proxy_add_x_forwarded_for;
        proxy_set_header X-Forwarded-Proto $scheme;
        proxy_set_header Upgrade $http_upgrade;
        proxy_set_header Connection "upgrade";
        proxy_read_timeout 300;
    }
}
sudo nginx -t
sudo systemctl reload nginxPoint the subdomain at the VPS, then issue a certificate with Certbot or another TLS manager. Expose administration only over HTTPS. When using Cloudflare or another proxy, ensure WebSockets are enabled and verify source-IP handling.
5. Secure the administrator account
Open https://status.example.com and create an administrator with a long unique password. Enable two-factor authentication when supported by your installed version, and store recovery codes away from the host.
The dashboard contains internal URLs, tokens, webhooks, and incident history. If public access is unnecessary, restrict it through a VPN, IP allowlist, or an additional authentication layer. Keep public status pages separate from administrative access.
6. Configure a useful website monitor
Monitor an HTTPS endpoint that is lightweight but verifies an important dependency. A cached home page may return 200 even when the database is unavailable. A health endpoint should represent actual serviceability without exposing secrets.
- URL: use HTTPS and the real hostname.
- Interval: 60 seconds is often sufficient.
- Retries: 2–3 attempts reduce transient packet-loss alerts.
- Timeout: keep it below the interval and aligned with the SLA.
- Accepted status: accept only codes that mean real success.
- Certificate expiry: alert early enough to repair renewal.
Do not automatically treat every redirect as healthy. A redirect loop or unexpected login redirect can hide an endpoint failure.
7. Validate API response content
An API can return HTTP 200 with an error in its body. Use a keyword or JSON query to verify a stable business signal such as status equal to ok.
GET https://api.example.com/health

{
  "status": "ok",
  "database": "ok"
}
The health endpoint should not call expensive services every minute or expose versions, stack traces, or credentials. If authentication is needed, use a read-only least-privilege token with a rotation plan.
8. Monitor cron and backup jobs with Push
A Push monitor is more useful than server ping for scheduled jobs. Call its unique URL only after the job succeeds:
#!/usr/bin/env sh
set -eu

/usr/local/bin/run-backup
curl --fail --retry 3 \
  "https://status.example.com/api/push/REDACTED?status=up&msg=OK"
Set the expected interval and grace period above normal runtime. Treat the push URL as a secret and keep it out of public logs, screenshots, and repositories. Send success only after verifying the backup completed.
9. Build actionable notifications
Create a notification channel and use its test button before attaching it to monitors. Maintain at least one channel outside the monitored infrastructure. If an internal mail server is monitored, do not rely exclusively on that same server for alerts.
- Retry before declaring DOWN.
- Use maintenance windows for planned deployments.
- Group production, staging, internal, and critical monitors.
- Page on-call staff only for services with clear impact and a runbook.
- Test both DOWN and RECOVERY notifications regularly.
10. Publish a useful status page
Use user-facing service names such as Website, API, Payments, and Email instead of internal hostnames. Publish only appropriate monitors; never expose management endpoints, private IPs, or server names.
Automated status does not replace incident communication. Post a brief update with impact, start time, and next update during an incident. Avoid publishing an unverified cause.
11. Back up Uptime Kuma
Back up the host directory mounted at /app/data. Stop the container briefly for a consistent copy:
cd /opt/uptime-kuma
docker compose stop uptime-kuma
tar -czf /srv/backups/uptime-kuma-$(date +%F).tar.gz data
docker compose start uptime-kuma
Copy archives to another machine, encrypt them, and apply retention. Periodically restore into a test host. Monitoring backups may contain notification settings and tokens, so protect them as secrets.
12. Update with a rollback plan
Read release notes, especially before a major upgrade, and create a backup first:
cd /opt/uptime-kuma
docker compose pull
docker compose up -d
docker compose logs --tail=100 uptime-kuma
Test login, monitors, notifications, and status pages afterward. Environments that require controlled change can pin a tested version and upgrade on schedule. Before rolling an image back, confirm that its data format remains compatible.
13. Common problems
- Dashboard disconnects: WebSocket headers are missing or the proxy timeout is too short.
- DOWN while a browser works: test DNS, routing, and firewalls from inside the container, not from a laptop.
- IPv6-only failure: the Docker network lacks IPv6 or DNS publishes an unusable AAAA record.
- Old certificate after renewal: a proxy/CDN still serves the old chain or the monitor reaches another endpoint.
- No notification: the channel was not tested, its token expired, or it was not attached to the monitor.
- Configuration disappears: the persistent volume was not mounted at
/app/data.
Production checklist
- Host Uptime Kuma outside the primary monitored infrastructure.
- Bind the application port to localhost and use an HTTPS reverse proxy.
- Protect administration with a strong password, 2FA, VPN, or suitable allowlist.
- Tune retries, timeouts, and intervals to the service SLA.
- Test alerts through a controlled failure.
- Back up
/app/dataoff-host and test restoration. - Review releases, pin tested versions, and prepare rollback.
- Monitor Uptime Kuma itself from an independent service when availability is critical.
Conclusion
Uptime Kuma provides a compact external-monitoring layer for websites, APIs, TLS certificates, and scheduled jobs. Its value is not merely a green dashboard: the observation point must be independent, alerts must reach the right person, incidents need runbooks, and the monitoring system itself must be backed up, updated, and tested like any production service.




No comments yet. Be the first to share your thoughts.