
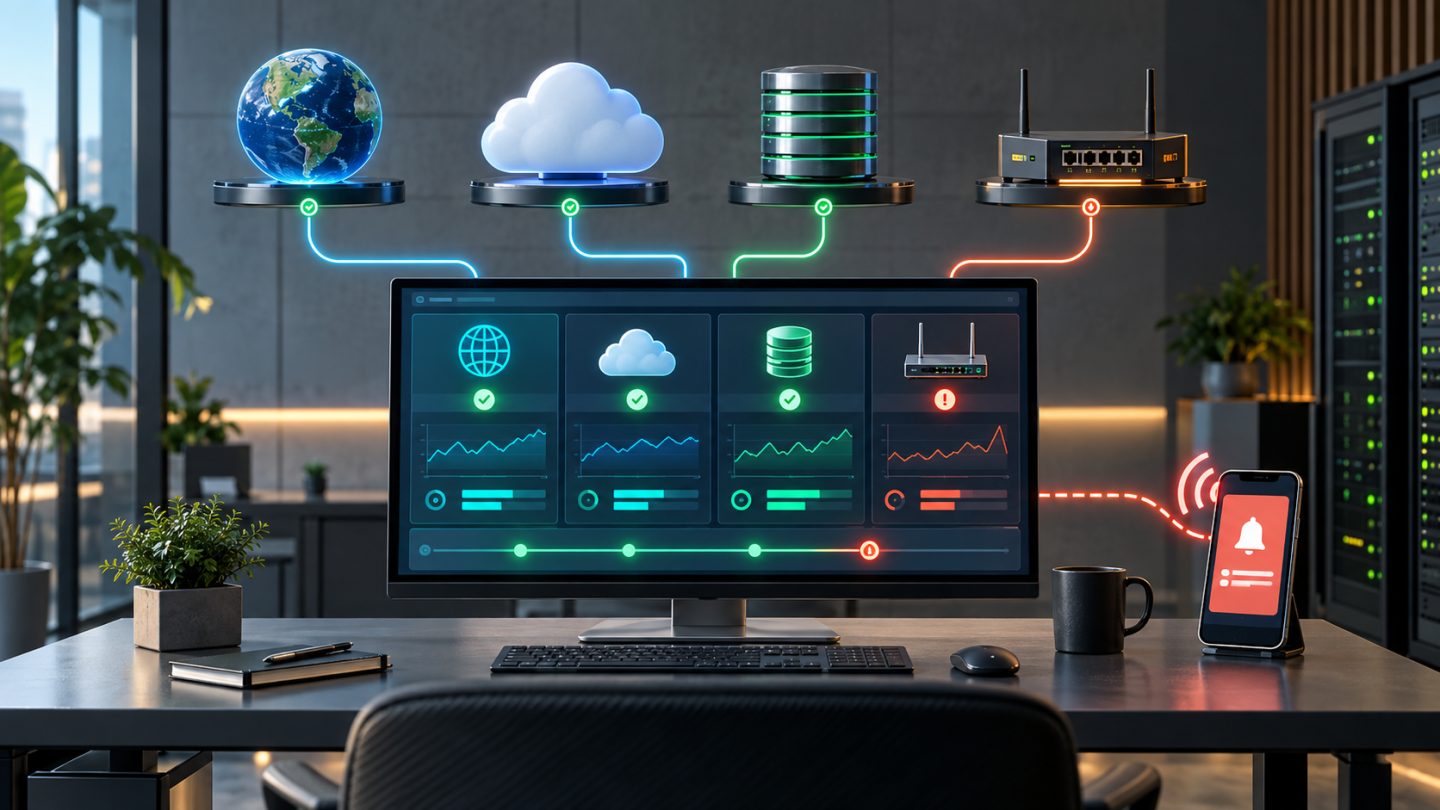
A good monitoring system is not the one with the most charts; it is the one that detects the right failure, reaches the right person, and provides enough context to act. For a small business, the goal is visibility into customer experience, infrastructure health, and emerging risk without creating another complex platform that needs constant care.
Start with the business question
Before selecting tools, identify services that directly affect revenue or operations: the public website, API, email, VPN, internal software, database, or office connection. Each service needs an owner, an availability expectation, and an acceptable interruption window.
A brochure website may tolerate a business-hours response, while checkout or an order API needs immediate escalation. When every event is urgent, responders quickly learn to ignore alerts.
The four essential monitoring layers
| Layer | Question | Primary signals |
|---|---|---|
| External checks | Can customers reach the service? | HTTP, DNS, TLS, TCP, content, response time |
| Infrastructure | Is a host approaching resource exhaustion? | CPU, memory, disk, inodes, network, load, services |
| Application | Is the application correct and fast? | Request rate, errors, latency, queues, database connections |
| Business | Does the value-producing flow work? | Orders, payments, login, transactional email, synchronization |
Ping alone is insufficient: a server can answer ping while its website returns 500. Conversely, high CPU does not always affect customers. Combine user-facing signals with internal data for both detection and diagnosis.
A minimum viable architecture
- An uptime service outside the primary infrastructure checks websites, APIs, DNS, and TLS.
- An agent or exporter on servers exposes resource and service metrics.
- A time-series store such as Prometheus provides history and deeper queries when needed.
- A dashboard layer such as Grafana supports investigation and trends.
- An alert manager provides grouping, silencing, and routing.
- A notification channel remains independent of the monitored system.
Do not place all monitoring on the same server as the website. When that host loses power or fills its disk, monitoring disappears with it and cannot report the failure.
Select tools by operational maturity
Level 1: A few websites or VPS instances
Use a managed uptime service or a lightweight self-hosted tool for HTTP, keyword, TCP, and TLS checks. Add disk, memory, and service alerts from the VPS provider. This level fits teams without a dedicated operator.
Level 2: Multiple servers and applications
Use Prometheus to collect time-series metrics over HTTP, exporters for operating systems and applications, Grafana for dashboards, and Alertmanager or Grafana Alerting for notifications. This stack is flexible but needs ownership for updates, backup, retention, and security.
Level 3: Many services or an on-call requirement
Add centralized logs, tracing, SLOs, schedules, escalation, and incident management. Upgrade only when complexity measurably reduces detection or recovery time; do not deploy a full observability stack simply because the components are available.
The first monitors to create
- Primary website: HTTPS 200, important content keyword, and latency.
- API health: a lightweight endpoint that still checks core dependencies.
- DNS: expected address or critical record.
- TLS: alerts 30, 14, and 7 days before expiration.
- Synthetic business flow: test login or sandbox transaction when safe.
- Servers: disk, inodes, memory, load, network, and service processes.
- Database: connections, query latency, storage, replication, and backup status.
- Queues: depth, oldest-job age, failures, and worker count.
- Backups: last success and restore-test result, not merely job status.
Use golden signals instead of watching everything
For web services, four useful signal groups are latency, traffic, errors, and saturation. They reveal whether customers are slow or failing, current load, and resources near their limits. Infrastructure dashboards still matter, but wake-up alerts should prioritize symptoms affecting users.
Ninety percent CPU for one minute may be expected work. A five-percent checkout error rate lasting five minutes is usually more actionable. Use time windows and pending periods to filter short spikes.
Design actionable alerts
Every alert should answer six questions:
- Which service is affected?
- What is the customer or business impact?
- Which signal crossed what condition and for how long?
- How urgent is it?
- Who owns the response?
- Where are the runbook and investigation dashboard?
Prometheus separates rule evaluation from notification delivery: rules produce alerts, while Alertmanager groups, inhibits, silences, and routes them. This lets related symptoms become one incident instead of dozens of notifications when one database breaks several services.
Three notification levels
| Level | Example | Channel |
|---|---|---|
| Critical | Checkout unavailable, data loss, widespread API errors | Call or push to on-call with escalation |
| Warning | Rapid disk growth, elevated latency below SLO breach | Operations channel during business hours |
| Info | Deployment, successful backup, renewed certificate | Dashboard or event log, no page |
If no action is possible, an event belongs on a dashboard rather than in an alert. Review alerts monthly and fix or remove those that never lead to action.
Dashboards for decisions
Do not place every metric on one screen. Maintain three views:
- Service overview: availability, latency, errors, traffic, and open incidents.
- Investigation: CPU, memory, disk, database, queues, dependencies, and deployment markers.
- Capacity: 30-90 day trends, storage growth, peak traffic, and projected limits.
Every chart needs clear units, source, and scope. Average latency can hide very slow requests; use percentiles such as p95 or p99 where appropriate.
Runbooks turn alerts into responses
A short runbook should include verification steps, the first safe action, rollback conditions, escalation contacts, and evidence to preserve. A disk-space alert, for example, should link to a process for checking filesystems, inodes, logs, containers, and open deleted files.
During maintenance, use a scoped, expiring silence instead of disabling all alerts. Confirm monitors recover and the silence expires afterward.
Secure the monitoring system
- Do not expose dashboards or metrics endpoints publicly without need.
- Use HTTPS, SSO or MFA, and role-based access.
- Never place passwords, tokens, customer email, or sensitive queries in metric labels.
- Protect notification webhooks and rotate secrets.
- Control cardinality; user IDs and request IDs can rapidly inflate metric storage.
- Back up configuration, dashboards, rules, and contact points.
- Place monitoring in a different failure domain from critical workloads.
A 30-day rollout
- Week 1: inventory services, owners, criticality, and contacts.
- Week 2: deploy external uptime, TLS expiry, and backup monitoring.
- Week 3: collect server and application metrics, build an overview, and create the five most important alerts.
- Week 4: simulate a website outage, near-full disk, and false positive; tune thresholds, routing, and runbooks.
Track two initial operational measures: mean time to detect and mean time to recover. The first objective is not a beautiful dashboard; it is learning about failures before customers do and reducing confusion during response.
Estimate cost honestly
Self-hosted does not mean free. Costs include the monitoring server, metric and log storage, backups, patching, security, and operator time. Managed services charge a subscription but reduce operational work. A hybrid often suits a small team: external uptime from outside, with internal metrics self-hosted or managed according to capability.
Do not retain every metric forever. Choose scrape intervals and retention for investigation, reporting, and capacity planning. Detailed data can expire sooner while aggregates remain longer.
Acceptance checklist
- Every important service has an owner and priority.
- External monitoring does not share the website's failure domain.
- HTTP, DNS, TLS, and critical business flows are covered.
- Servers, databases, queues, and backups expose required signals.
- Alerts use pending periods and have explicit recipients.
- Every critical alert links to a dashboard and runbook.
- Notification and escalation paths have been tested.
- Dashboards, rules, and configuration are backed up.
- Alert noise and capacity are reviewed monthly.
Conclusion
Small-business monitoring should begin with critical services and human response, not a tool catalog. One trustworthy external check, a few correct metrics, an owned alert, and a runbook often provide more value than hundreds of dashboards. As the environment grows, Prometheus, Grafana, and alert routing provide a clear expansion path without requiring everything on day one.




No comments yet. Be the first to share your thoughts.